Crossdating tree rings from Mt. Read, Tasmania
Introduction
Dendrochronology is the study of dating tree rings. It is extremely useful in determining the age of tree samples, as well as providing information about the climate and atmospheric conditions from the past through dendroclimatology. Furthermore, it also allows for analysis of the local present climate for use in planning. Some studies have even shown that dendrochronology can be used at determining slope stability (Wistuba et al. 2019).
Tree ring thickness is an important measurement in dendrochronology. The growth rate of a tree changes in conjunction with the seasons. Cells of the earlywood are larger and have thinner walls than that of the latewood (Granato-Souza et al. 2019). The thickness of tree rings varies year by year depending on the conditions of the environment. Generally, a necessary temperature, cloud cover and moisture availability yield more growth and therefore thicker rings. Analysing these rings makes it possible for palaeoclimatologists to gather information regarding the historical atmospheric conditions.
For this practical class, the images of samples were taken from Mt Read in Tasmania. Scientists often collect a few samples from a variety of trees and selection is typically based on their sensitivity to climate. A number of samples were taken from several trees to achieve a more complete and accurate record for the 110 years dated.
Aims
The aim of this practical was to cross date a number of tree samples from Mt Read in Tasmania. By the end of the practical, the class was to be able to skeleton plot a tree sample, compare multiple tree samples, and get a better understanding of dendrochronology and how tree rings can be used to reconstruct past climates.
Questions
- Briefly outline the process of skeleton plotting. Discuss the similarities and differences in the four skeleton plots made by your group. [10 marks]
Skeleton plotting involves the marking of tree rings on a piece of graph paper. Instead of marking every ring, dendrochronologists only measure the noticeably narrow (above the line) or broad rings (below the line). This technique highlights the seasons of poorer conditions (narrow rings) and healthier conditions (broader rings). The skeleton plot completed in the practical class is shown below (Figure 1).

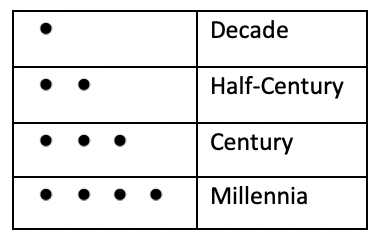
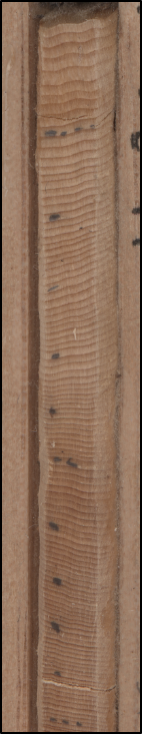
The sample used was H26nne and was cross dated from 1900 until 2009. On this sample, there are number of black dots. Table 1 and Figure 2 below demonstrate what these dots represent.
After the skeleton plot was completed it was compared and contrasted to two other skeleton plots from different trees. Some of the narrow and broader rings were exclusive to a specific tree, however many years overlapped. This is shown in Table 2.
Table 2 shows the specific narrow and wider years that overlapped for the different trees. These were listed for when at least two trees coincided. The italics represent at least three trees corresponding to the same narrowing or widening

- Plot a graph that shows the four-measured series from your group and describe differences and similarities in the four-measured series. Ensure your graph is fully and correctly labelled.

- Are the differences/similarities in the graph also seen in the skeleton plot [4 marks]
As shown in Figure 3, there are many similarities and differences between the four samples. The general trend of all samples appears similar, however there are many spikes and troughs unique to just one sample. An example of this is the H26nne sample from the year 2000 onwards, where it spikes and troughs at a higher ring width unique to the other samples.
There are some similarities to the skeleton plot, such as the year 1951-52 where all samples take a sudden trough corresponding to the narrower year marked in the skeleton plot. This is also seen around the year 1938-39 where all the samples have a slight spike, corresponding to the broader year marked in the skeleton plot.
- What do you think might account for the differences/similarities in the measured series (e.g. are there large or small rings in common amongst the series)? [4 marks]
Tree ring thickness is dependent on the season and what is happening at the time of growth. When all samples are similar (similar spikes/troughs), the trees all have experienced a similar condition. This could be due to higher or lower precipitation rates or temperatures during a season, or perhaps a disturbance such as bushfires, droughts or flooding.
When there are narrower/broader rings unique to one sample, the conditions have only affected this tree. The location of this particular tree could be on richer or poorer soil or has less moisture availability. This individuality can also be explained through disturbances such as a tree falling and disrupting the growth.
- Describe any challenges you think may arise in the process of measuring, skeleton plotting and crossdating tree-rings. [5 marks]
There is a degree of inaccuracy in all of these processes. Crossdating aims to minimise this, however it is not always possible. Determining the ring width can be difficult also. This was experienced in the H26nne, where there was a split in between two tree rings, making it an uncertain ring width.
Multiple people completing skeleton plots also adds a degree of uncertainty. Whether a ring is narrower or broader than the surrounding ones is quite subjective, and thus produce a variety of results.
- Why is crossdating so important in dendrochronology? [12 marks]
Crossdating is a pivotal factor in dendrochronology. It involves comparing samples from many trees and looking at similarities and differences in factors of these samples, in particular tree ring width. The process of matching patterns of growth variation amongst many samples allows a more complete and accurate reconstruction of the past (the more data, the more reliable!).
Figure 1 shows a skeleton plot. Crossdating of this against other skeleton plots creates years of overlap, where years of noticeably greater or less growth are recognised.
Table 2 shows the years where overlapping occurred. These years are considered more reliable, as more data supports the idea. The more crossdating that occurs, the clearer the picture gets in regard to reconstructing the past climate.
- Choose one of the references provided [in red] at the end of the seminar slides that describes a tree-ring based reconstruction of some kind. In no more than 1-2 paragraphs, briefly describe the key aspects of the study. You should include answers to the following questions:
Allen KJ, et al. (2015) Preliminary December-January inflow and streamflow reconstructions from tree-rings for western Tasmania, southeastern Australia. Water Resources Research doi 10.1002/2015WR017062
- Where is the study based? [2 marks]
This study is based in western Tasmania, south eastern Australia.
- What parameter are the authors reconstructing? [3 marks]
Inflow and streamflow.
- Did they reconstruct the parameter for a single point or across space (this should be obvious in the results)? [5 marks]
This parameter was reconstructed across a space rather than a single point. From the Methods section, Figure 1 illustrates the different sites where tree ring samples were gathered. As evident from the Results and Discussion sections, the parameter was reconstructed across western Tasmania and therefore across a space.
- How did the authors assess the value of their reconstruction (e.g. through statistics, comparison to other reconstructions, other evidence)? Please note you are not to provide detailed explanations of any statistics used. However, it is expected that you understand the meaning of basic statistics such as R2. [6 marks]
In Section 3.1, the authors provided tables (Tables 3 and 4) that indicate the calibration and verification of their results. They used a number of chronologies (up to 12) in order to achieve more accurate and complete results. Comparisons were also made to other studies and historical sources. One such comparison is to Mpelasoka et al. (2008), where the reconstructions match all but one of the droughts identified. Another such example is Verdon-Kidd and Kiem (2009), where the authors of the western Tasmania paper believe their reconstruction clearly captures drought around the turn of the 20th century, as demonstrated by Verdon-Kidd and Kiem.
- Outline the major conclusions of the study. [10 marks]
The study reconstructed inflow and streamflow from tree ring chronologies. This was related to the demand for hydroelectricity, a renewable form of energy. Using the reconstruction of the past climate, a better estimation for future inflow and streamflow is achieved. Recent decreases in precipitation over the region were discovered, and how this can affect the western Tasmanian community. The inflow and streamflow datasets were compared to large-scale ocean-atmosphere processes such as the El Nino-Southern Oscillation and the Southern Annular Mode, and substantial relationships were found. By estimating the future climatic conditions, in particular precipitation and streamflow, a better understanding of water resources and management can be developed. The study concludes that there is a constant demand for studies into this area of palaeoclimatology. The dynamic climatic changes reinforce the need for better understanding of past hydrological conditions in order to better prepare for the future. This is particularly necessary in areas such as south eastern Australia, where these environments depend on them for domestic and industrial water supplies, agriculture, recreation and electricity production.
References
Granato-Souza D, Adenesky-Filho E, Esemann-Quadros K (2019) Dendrochronology and climatic signals in the wood of Nectandra oppositifolia from a dense rain forest in southern Brazil. Journal of Forestry Research 30(2), 545-553.
Wistuba M, Malik I, Badura J (2019) Tree rings as an early warning against catastrophic landslides: Assessing the potential of dendrochronology for determining slope stability. Dendrochronologia 53, 82-94.
